In addition to the join types in Crystal Reports, there are other conventions related to connecting views that are required for reports being uploading to PowerSchool SMS.
Directional links
All of the connections in your report must move in a single direction outward from your root view.
When connecting views, you should organize them in Crystal Reports so that they flow logically from left to right. Any joins that do not move in this direction will cause the report to be rejected when it undergoes the validation process at upload time.
Aliased views
If necessary, you can add the same view to a report more than once. Crystal Reports creates an alias for the additional version by adding _1 to the end of the view’s name. You can change the name of the aliased view to something more distinctive, if required.
The ability to add aliased views is particularly useful when one view accesses multiple types of the same information. For example, if you want to show a student’s physical address and mailing address on the same report, you must add the view for addresses twice. You then link the student’s record to one instance of the view on the reference ID for physical address, and to the other instance on the reference ID for mailing address.
Note: In this case, consider changing the name of both instances of the view to reflect their respective natures.
Intersection views and reference IDs
There are two ways to link views:
|
=
|
Intersection views are special views created to link views in a one-to-many relationship. The intersection view contains no actual fields – just the ID fields of the two views it joins. |
|
=
|
Reference IDs are special fields that reference the IDs of other views. The reference ID is used to link views in a one-to-one relationship. |
To illustrate, use the example of a simple report that shows the name and enrollment status of all of the students in a particular school.
The first step of the process is to determine the view that the entire report will be based on. This is known as the root view. All of the links between views move outward from this root view. For the example, the root view is the view for the school, which will then have a collection of students associated with it. The name of our root view in this case is DA_School, which has an ID field of SchoolID.
Because the school must have a collection of students attached to it, the next step is to look for a view of students related to a particular school and the appropriate intersection view. In this case, that view is called DA_SchoolStudent, and the intersection view is called DA_School_I_Students.
To link your views [Figure 323], connect the ID field of the first view (1) to the same field in the intersection view (2), then connect the other ID field key from the intersection view (3) to the related field in the second view (4). The links look like this:
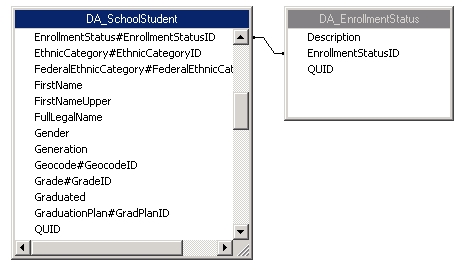
There is then a one-to-one relationship between a student and his or her enrollment status [Figure 324]. Identify the reference ID in the DA_SchoolStudent, which is EnrollmentStatus#EnrollmentStatusID. Add the view DA_EnrollmentStatus to the report and the link from the reference ID in DA_SchoolStudent to the ID field, EnrollmentStatusID, in the other view. Then, you join the QUIDs for both views. The link looks like this:
Query ID connections
In addition to IDs and reference IDs, each view contains a Query ID, or QUID, used to uniquely identify the version of a report being run by a particular user. This ensures that if multiple users are running the report at the same time, a user will receive the appropriate data in their version of the report.
In order to ensure that a single ID applies to all views in the report, you must link the QUIDs of all of the views in the same order as the links between IDs, intersection views, and reference IDs were made.


 to expand
 .
. , and then drag the handle.